
Resource Timing - Part 3 (Waterfall Chart)
This is post #3 in the category "Browser Tools", focusing on understanding the loading times by charting them in a Waterfall chart. In part 1 and part 2 about Resource Timing I covered the attributes startTime,
responseEnd, duration and initiatorType. Now I want to understand what happens after a resource starts loading and what do some attributes mean, like fetchStart, requestStart and responseStart, to mention the most relevant ones.
The Context
Let's shortly sum up how we gather those data. There is a built-in Resource Timing API (read more in part 1) that you see in action, right here:
window.performance.getEntriesByType('resource')
This call returns the following insights. Try it out in your browser's console!
[{
    // ... shortened
    name: "https://picostitch.com/_global.css",
    startTime: 81.32500003557652,
    fetchStart: 81.32500003557652,
    requestStart: 123.62999998731539,
    responseStart: 395.3000000328757,
    responseEnd: 404.55500001553446,
    // ... shortened
}, {...}]
As you can see above window.performance provides these data right in the browser (details in the previous
parts of this series).
From here on we will go deeper and look at the attributes fetchStart, requestStart and responseStart
in order to see which parts belong to loading one resource. Even though duration can give us the overall loading time, the API does also provide more granular information.
The Waterfall Chart in Action
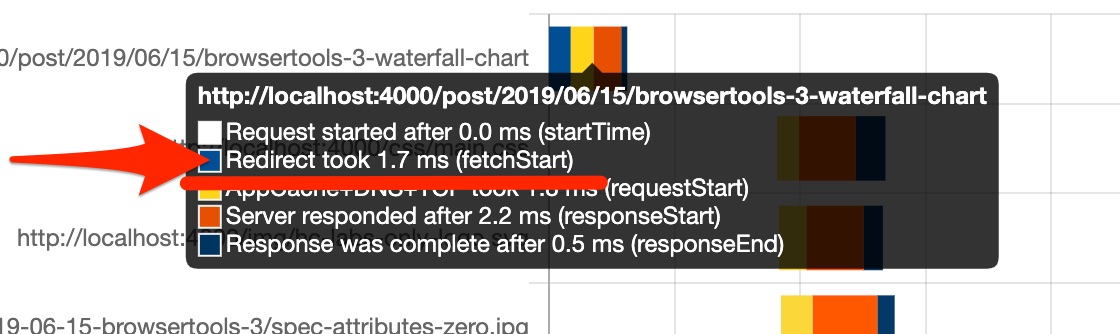
For better understanding the attributes, let's chart them. The Waterfall chart below initially shows each of those attributes for the first seven requests only (you can show all, see buttons below). Hover over (or click) each line to see the value of each attribute and read on to find deeper explanation of each of them.
Note: The times in the chart above, are calculated differences using the values the API's returned. The time shown in the tooltip is always the difference to the previous attribute.
For example: if startTime and fetchStart have the value 23, the tooltip will show
Request started after 23.0 ms (startTime) and Redirect took 0.0 ms (fetchStart).
The fetchStart attribute
Often fetchStart has the value 0ms. That is because the according resource started to be fetched right away after the startTime was recorded. In the end this is an browser internal, the
spec only says it as the "time immediately before the user agent starts to fetch the resource". But it also means that no redirect took place, see the image from the spec below.
On the other hand be careful interpreting the numbers, the browser might be "working" between each of the measurement points. Even if you see in the chart Redirect took 1.7 ms (fetchStart) (instead of 0ms), it is also possible that the browser just started measuring the data later because it was busy with something else.
That's why looking at the raw data, as the chart shows them above needs knowledge on how to understand them! If a redirect took place can be seen though by calculating redirectEnd - redirectStart, in case of no redirect it will be 0.
Looking at it from the numbers point of view the fetchStart is at least made up out of:
fetchStart >= startTime + redirectDuration
// with
redirectDuration = redirectEnd - redirectStart
("redirectDuration" is a variable that I introduced, the spec does not define it).
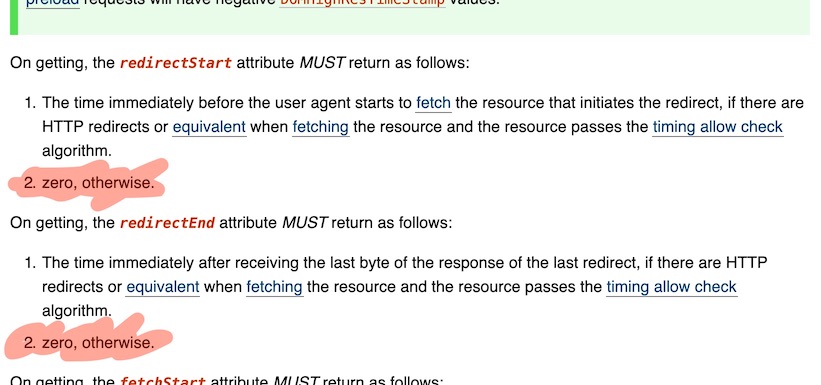
One interesting aspect is that the spec defines some kind of logic into the values of some attributes. Some attributes can have the value 0, for example redirectStart and redirectEnd. This might not be interpreted as "redirect started at 0ms" but rather as "there was no redirect". Even though it feels strange and requires more effort using the values, I think it's a clever move. See below a screenshot from the spec text.
The requestStart attribute
The attribute requestStart has the timestamp when the real data are about to be requested, that means after DNS lookup ("domainLookupDuration") and TCP handshake ("connectDuration"). The spec says it is the
"time immediately before the user agent starts requesting the resource from the server, or from relevant application caches or from local resources". That means when one thinks about working on the website speed that all optimization on this resource up to here might contains infrastructure work, connection caching or pre-fetching. Depending on what one found out is the bottleneck, knowing what these attributes are made of allows for focusing effort on where to work on page speed.
Taking requestStart apart a little bit can even show hints where slow sites have potential. Also consider that optimization of the parts that make up requestStart might effect many more requests, a speedup might be worth it.
This attribute contains at least the following times:
requestStart >= startTime + redirectDuration
                + domainLookupDuration + connectDuration
// with
redirectDuration = redirectEnd - redirectStart
domainLookupDuration = domainLookupEnd - domainLookupStart
connectDuration = connectEnd - connectStart
(the variables "domainLookupDuration" and "connectDuration" are not defined in the spec, they are here for convinience).
The responseStart attribute
The next interesting attribute is responseStart which the spec describes as the
"time immediately after the user agent receives the first byte of the response from relevant application caches, or from local resources or from the server". If this time is very high, it is most likely the server that takes it easy delivering the resource, this might be a resource to be optimized.
Besides all the mentioned attributes there are some more, which will be documented in the chart below. It shows well how they all relate to each other and when they might occur in the progress of loading a resource.
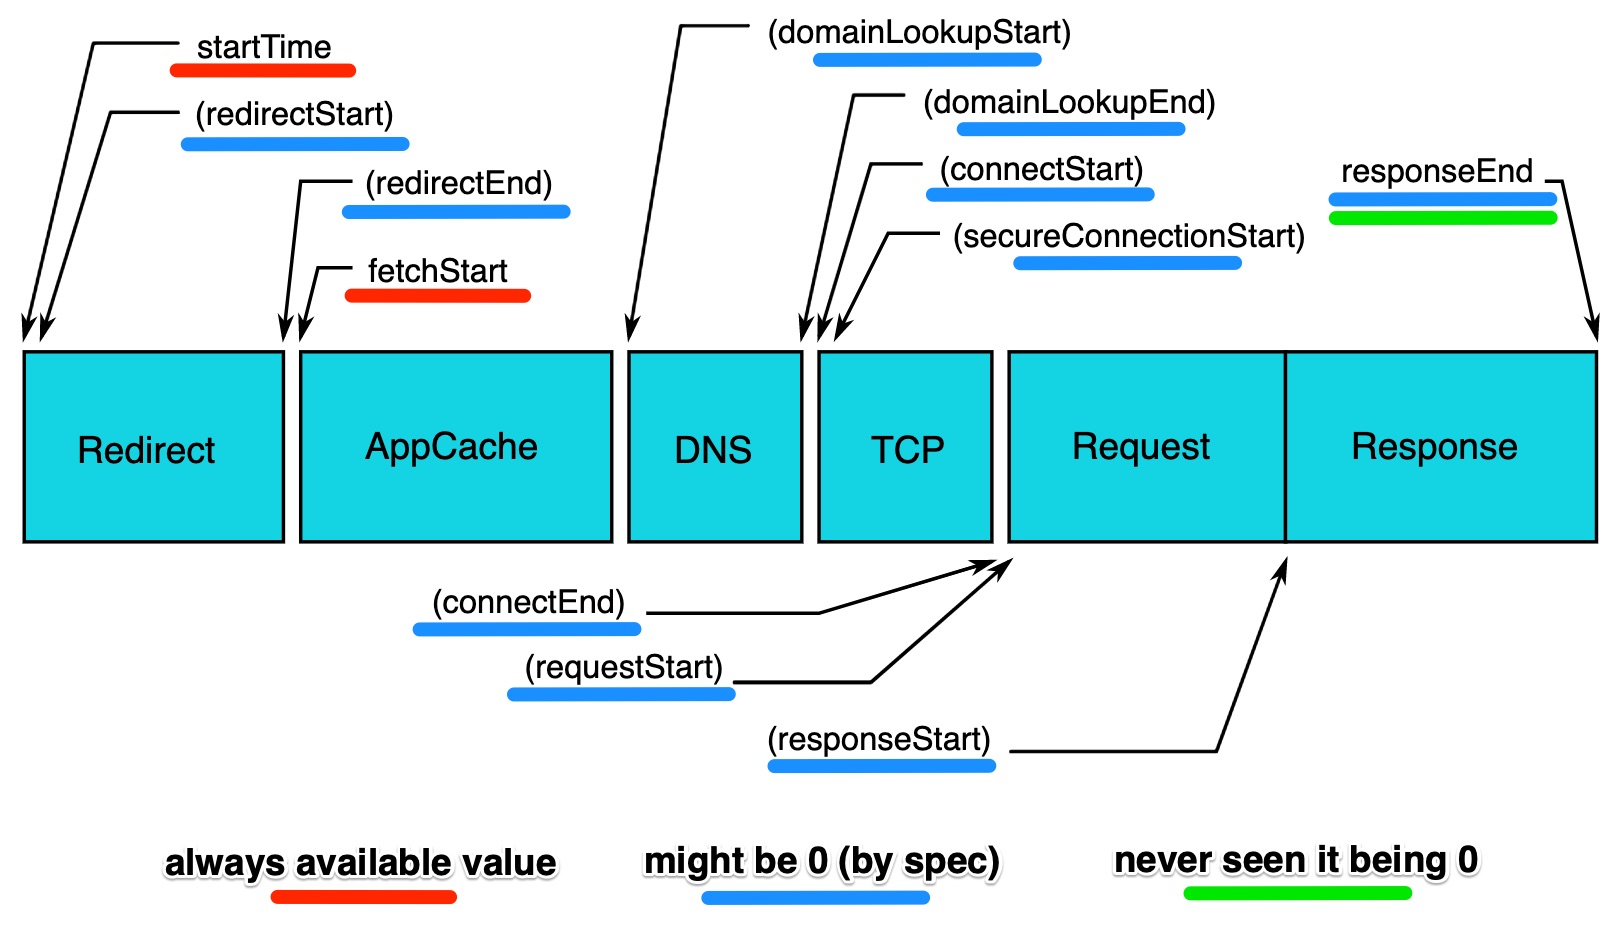
The chart is taken from the spec and slightly enhanced, to show the attributes and some comments about them.
Let's Investigate More
I hope disecting window.performance especially the Resource Timing API triggers some interest in diving deeper into page timing insights. The most common use case, of course, is optimizing page speed. Since page speed is a very complex topic I hope this helps getting some handle on how to look at it.
Main photo by Michelle Rosen on Unsplash
The first version of this post I wrote and published for the HolidayCheck TechBlog, June 2019.